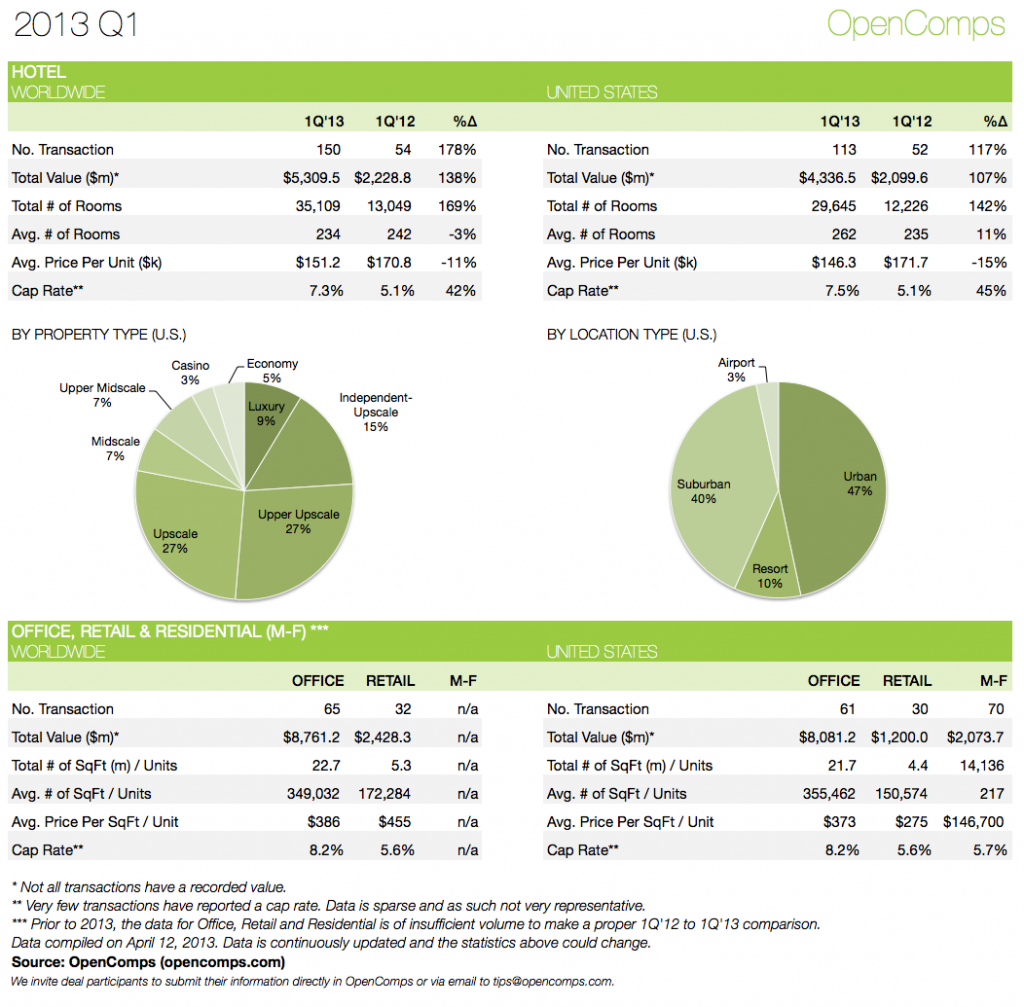
With the first quarter of 2013 behind us, we thought we should take a look at the volume and trend data. After observing a decrease in volume and cumulative value for hotel transactions at the end of 2012 compared to 2011, the trend in 2013 has reversed significantly and for the better. First quarter of 2013 saw 150 transaction worldwide and 113 in the U.S. vs. only 54 and 52, respectively, in the first quarter of 2012. That is a jump of 178% worldwide and 117% in the U.S. (Naturally, our tracking of non-U.S. transaction is still very sparse, so the real observable trend is in the U.S.).
We also decided to provide you with a summary of the distributions by property type and location type for the first quarter. Interestingly, investors are almost equally focused between Urban and Suburban properties with the focus on Upscale and Upper Upscale properties. (We recently updated our property types classifications to align ourselves with the latest STR classifications; clean up, though, is still in process).
As for tracking office, retail and residential transactions, we really upped our game. In the first quarter, we tracked 61 office, 30 retail and 70 residential (multi-family) transactions in the U.S. with a few international sales here and there too. That is $8.1 billion, $1.2 billon and $2.1 billion in total transaction value for office, retail and residential properties, respectively. Given that these 2013 first quarter levels are already better than what we recorded for all of 2012, we believe we are doing a much better job staying on top of these asset types.
Of interesting (and peculiar) note in the retail stats is that the total U.S. recorded volume for the first quarter was $1.2 billion over 30 transactions. This was easily equalized(!) by Morgan Stanley Real Estate Fund’s purchase of the Metropolis Shopping And Entertainment Mall in Moscow, Russia for $1.2 billion ($1,360 per square foot). That’s what we call “investing big!”

